
TERN: Influenza Epidemic Forecasting with a Delta-Rule Memory
TERN (Temporal Erase-then-delta Recurrent Network) forecasts weekly influenza case counts several weeks ahead. We developed it in joint research with LTS, Inc. and published the paper on arXiv. On three public benchmarks covering Japan's 47 prefectures and two US datasets, it outperformed existing epidemic forecasting models and general-purpose time-series forecasters. The code and configurations are public.
Background
Influenza forecasts are a basic input to public health: they guide vaccine distribution and the timing of alerts. They are also hard to produce. Each region offers only a few seasons of data, and the waves shift in timing and height every year. Information that helps while a wave is growing becomes misleading once the peak has passed, whereas the shape of the previous season stays informative for a whole year.
Existing epidemic graph models and general-purpose forecasters read a short fixed window and treat all past information alike. They can neither exploit earlier seasons nor discard associations that have gone stale when the epidemic phase changes.
What we did
At the core of TERN is a memory whose forgetting and writing are controlled by the epidemic phase.
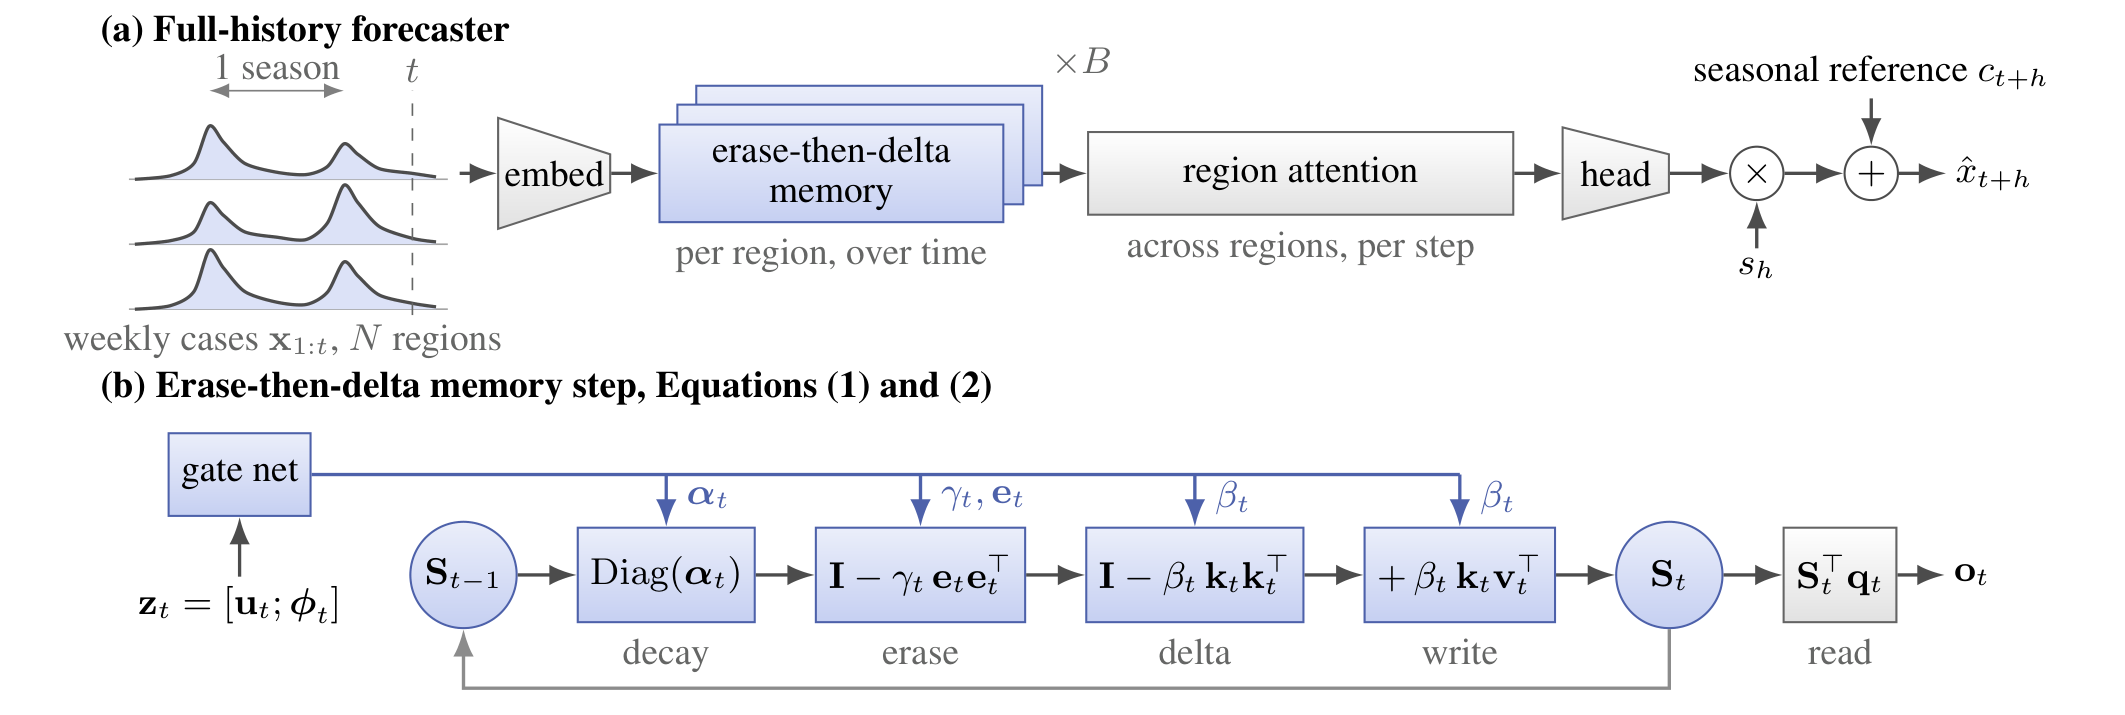
Architecture of TERN. (a) The forecaster: memory blocks that read each region's weekly counts over time, attention across regions, and a seasonal reference. (b) One memory step: gates driven by phase features set the strength of decay, erase, delta and write, and the erase address. Blue marks the proposed memory, grey the standard components (reproduced from Nagashima and Funayama [1], Figure 1)
A memory that erases and writes by phase. The model carries a fast-weight memory updated by the delta rule. It decays at a different rate per channel, and it erases old content along a learned address before writing new content. How strongly it erases and writes is decided by local phase features such as the growth rate and the week-over-week change in case counts. The design lets the model drop associations that were useful during the rise of a wave once the peak is behind it.
A seasonal reference and online adaptation. Rather than asking the memory to learn the annual cycle on its own, the model receives an explicit seasonal reference, such as last season's value at the same week or the climatological mean, with a learned weight. It is also updated as new observations arrive and blended with a seasonal naive forecast at a learned ratio.
Results
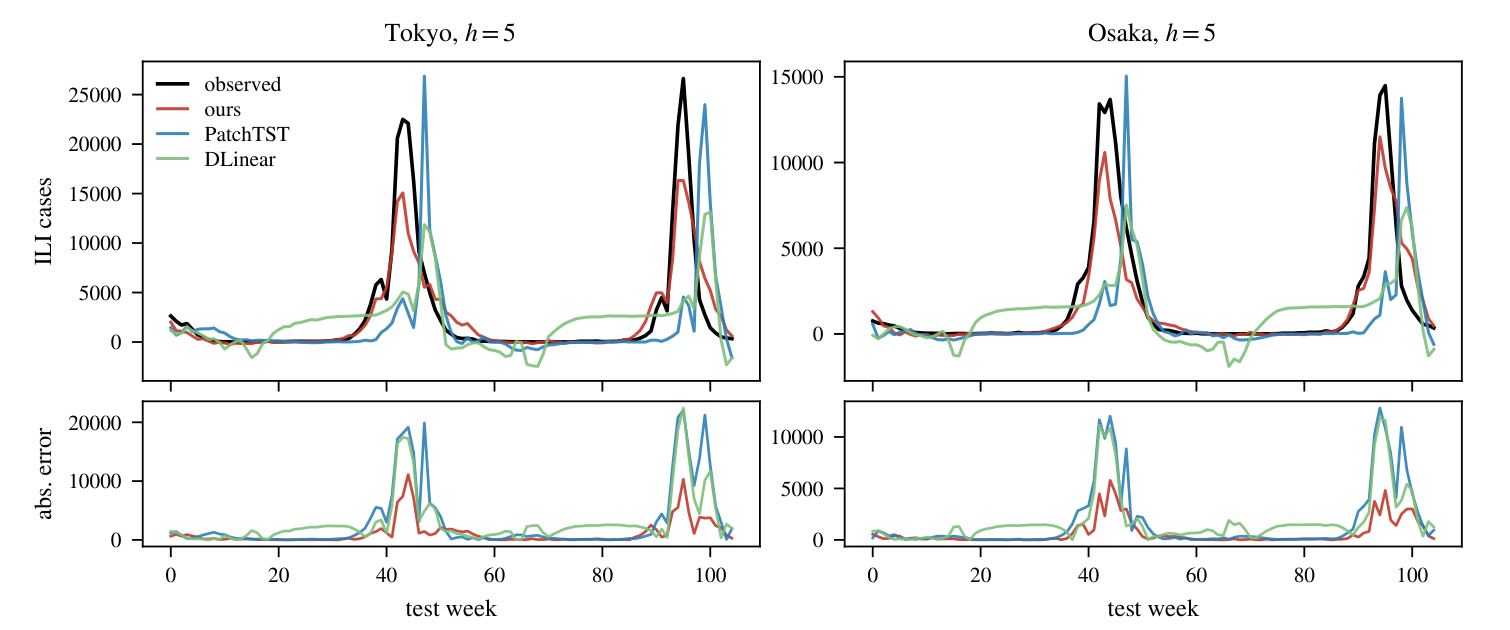
Five-week-ahead forecasts (top) and absolute errors (bottom) for Tokyo and Osaka. TERN placed all four peaks within one week of the observed peak, whereas PatchTST and DLinear peaked three to five weeks late (reproduced from Nagashima and Funayama [1], Figure 2)
We evaluated on the three public benchmarks standard in epidemic forecasting research: Japan's 47 prefectures (2012–2019, 348 weeks), 10 US HHS regions (2002–2017, 785 weeks) and 49 US states (2010–2017, 360 weeks), forecasting 3, 5, 10 and 15 weeks ahead. The comparison included seasonal references (last season's value, climatology), epidemic graph models (Cola-GNN, EpiGNN), general time-series forecasters (DLinear, PatchTST, iTransformer, TimeMixer, TimesNet) and zero-shot time-series foundation models (Chronos-2, TimesFM-3).
| Method | Japan RMSE / PCC | US regions RMSE / PCC | US states RMSE / PCC |
|---|---|---|---|
| Seasonal naive | 839 / 0.913 | 876 / 0.802 | 307 / 0.764 |
| Climatology | 1030 / 0.876 | 727 / 0.862 | 265 / 0.812 |
| Cola-GNN | 1254 / 0.839 | 957 / 0.775 | 212 / 0.877 |
| EpiGNN | 1234 / 0.831 | 852 / 0.799 | 200 / 0.892 |
| DLinear | 1731 / 0.543 | 1013 / 0.695 | 249 / 0.833 |
| PatchTST | 2026 / 0.185 | 1077 / 0.618 | 251 / 0.818 |
| iTransformer | 2039 / 0.318 | 991 / 0.687 | 220 / 0.865 |
| TimeMixer | 1998 / 0.216 | 1109 / 0.599 | 267 / 0.790 |
| TimesNet | 1965 / 0.284 | 1046 / 0.677 | 288 / 0.776 |
| Chronos-2 | 1314 / 0.776 | 698※ / 0.877※ | 207※ / 0.883※ |
| TimesFM-3 | 1498 / 0.683 | 340※ / 0.972※ | 139※ / 0.949※ |
| TERN (20-wk window) | 1145 / 0.857 | 885 / 0.775 | 206 / 0.885 |
| TERN (full history) | 838 / 0.926 | 698 / 0.872 | 199 / 0.898 |
Each cell shows RMSE (root mean squared error, lower is better) / PCC (Pearson correlation, higher is better), averaged over the four horizons. "Japan" is the 47-prefecture dataset, "US regions" the 10 HHS regions and "US states" the 49 states. Bold marks the best value in each column: TERN (full history) was the best of the 11 compared methods on all three datasets and all six metrics. Values marked ※ come from foundation models whose pre-training includes the US data, so they saw the evaluation period and are shown for reference only.
The results also show how hard the problem is. Simply repeating last season's value beat every published epidemic graph model at long horizons. TERN matched that seasonal naive in RMSE on Japan and exceeded it in correlation. In a controlled comparison that held everything except the memory fixed, the proposed memory improved RMSE by 3–22% over standard softmax attention, confirming that the gain comes from the memory itself.
Positioning and next steps
The evaluation is limited to three influenza benchmarks; other diseases and targets such as hospital admissions remain future work, as do probabilistic outputs. This is one of our efforts in the medical and healthcare domain, aimed at series where seasonality and regime changes overlap, such as epidemics and hospital bed demand.